SNAS672A November 2015 – January 2016 HDC1080
PRODUCTION DATA.
- 1 Features
- 2 Applications
- 3 Description
- 4 Revision History
- 5 Pin Configuration and Functions
- 6 Specifications
- 7 Detailed Description
- 8 Application and Implementation
- 9 Power Supply Recommendations
- 10Layout
- 11Device and Documentation Support
- 12Mechanical, Packaging, and Orderable Information
パッケージ・オプション
メカニカル・データ(パッケージ|ピン)
- DMB|6
サーマルパッド・メカニカル・データ
- DMB|6
発注情報
8 Application and Implementation
NOTE
Information in the following applications sections is not part of the TI component specification, and TI does not warrant its accuracy or completeness. TI’s customers are responsible for determining suitability of components for their purposes. Customers should validate and test their design implementation to confirm system functionality.
8.1 Application Information
An HVAC system thermostat control is based on environmental sensors and a micro-controller. The microcontroller acquires data from humidity sensors and temperature sensors and controls the heating/cooling system. The collected data are then shown on a display that can be easily controlled by the micro controller. Based on data from the humidity and temperature sensor, the heating/cooling system then maintains the environment at customer-defined preferred conditions.
8.2 Typical Application
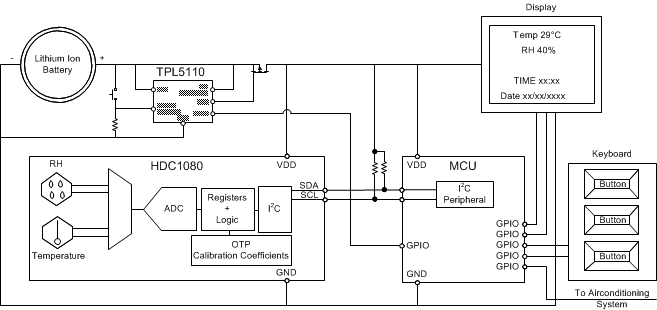
In a battery-powered HVAC system thermostat, one of the key parameters in the selection of components is the power consumption. The HDC1080, with 1.3μA of current consumption (average consumption over 1s for RH and Temperature measurements), in conjunction with an MSP430, represents an excellent choice for low power consumption, which extends the battery life. A system block diagram of a battery powered thermostat is shown in Figure 15.
 Figure 15. Typical Application Schematic HVAC
8.2.1 Design Requirements
In order to correctly sense the ambient temperature and humidity, the HDC1080 should be positioned away from heat sources on the PCB. Generally, it should not be close to the LCD and battery. Moreover, to minimize any self-heating of the HDC1080 it is recommended to acquire at a maximum sample rate of 1sps (RH + Temp). In home systems, humidity and the temperature monitoring rates of less than 1sps (even 0.5sps or 0.2sps) can be still effective.
8.2.2 Detailed Design Procedure
When a circuit board layout is created from the schematic shown in Figure 15 a small circuit board is possible. The accuracy of a RH and temperature measurement depends on the sensor accuracy and the setup of the sensing system. The HDC1080 samples relative humidity and temperature in its immediate environment, it is therefore important that the local conditions at the sensor match the monitored environment. Use one or more openings in the physical cover of the thermostat to obtain a good airflow even in static conditions. Refer to the layout below ( Figure 18) for a PCB layout which minimizes the thermal mass of the PCB in the region of the HDC1080, which can improve measurement response time and accuracy.
8.2.3 Application Curve
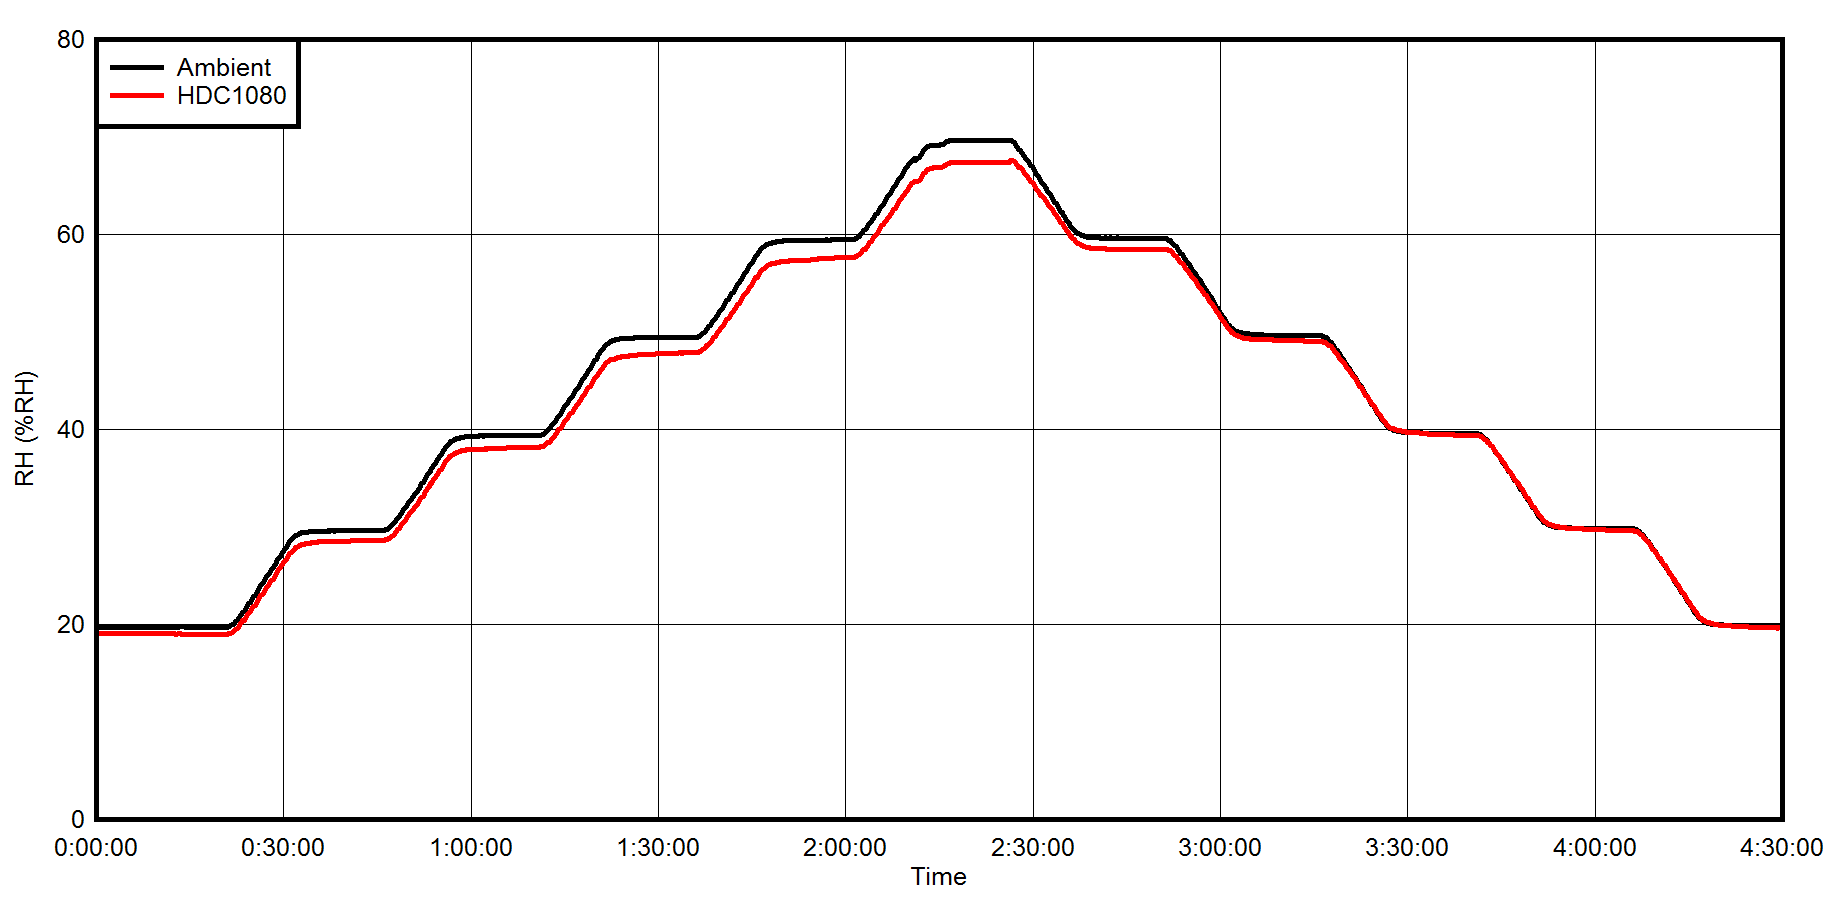
The data shown below was acquired with the HDC1080EVM. A humidity chamber was used to control the environment.
 Figure 16. RH vs. Time
8.3 Implementation and Usage Recommendations
8.3.1 Soldering
When soldering the HDC1080 use the standard soldering profile IPC/JEDEC J-STD-020 with peak temperatures of 260 °C.
When soldering the HDC1080 it is mandatory to use no-clean solder paste and no board wash should be applied. The HDC1080 should be limited to a single IR reflow and no rework is recommended.
8.3.2 Chemical Exposure and Sensor Protection
The humidity sensor is not a standard IC and therefore should not be exposed to particulates or volatile chemicals such as solvents or other organic compounds. If any type of protective coating must be applied to the circuit board, the sensor must be protected during the coating process.
8.3.3 High Temperature and Humidity Exposure
Long exposure outside the recommended operating conditions may temporarily offset the RH output. Table 10 shows the RH offset values that can be expected for exposure to 85 °C and 85 % RH for durations between 12 and 500 hours (continuous).
Table 10. Induced RH Offset Due to Extended Exposure to High Humidity and High Temperature (85°C/85% RH)
| 85°C/85% RH Duration (hours) | 12 | 24 | 168 | 500 |
|---|---|---|---|---|
| RH Offset (%) | 3 | 6 | 12 | 15 |
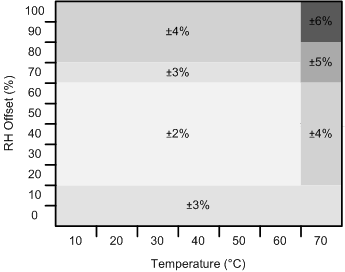
When the sensor is exposed to less severe conditions, Figure 17 shows the typical RH offset at other combinations of temperature and RH.
 Figure 17. Relative Humidity Accuracy vs Temperature