JAJSDL1D June 2015 – June 2018 LMT01
PRODUCTION DATA.
- 1 特長
- 2 アプリケーション
- 3 概要
- 4 改訂履歴
- 5 Pin Configuration and Functions
-
6 Specifications
- 6.1 Absolute Maximum Ratings
- 6.2 ESD Ratings
- 6.3 Recommended Operating Conditions
- 6.4 Thermal Information
- 6.5 Electrical Characteristics
- 6.6 Electrical Characteristics - TO-92/LPG Pulse Count to Temperature LUT
- 6.7 Electrical Characteristics - WSON/DQX Pulse Count to Temperature LUT
- 6.8 Switching Characteristics
- 6.9 Timing Diagram
- 6.10 Typical Characteristics
- 7 Detailed Description
- 8 Application and Implementation
- 9 Power Supply Recommendations
- 10Layout
- 11デバイスおよびドキュメントのサポート
- 12メカニカル、パッケージ、および注文情報
パッケージ・オプション
メカニカル・データ(パッケージ|ピン)
サーマルパッド・メカニカル・データ
- DQX|2
発注情報
6.10 Typical Characteristics
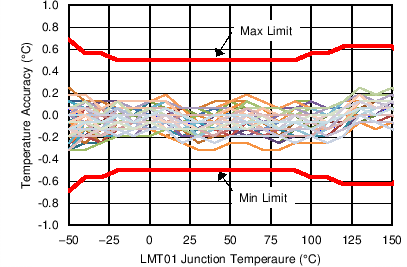
| Using Electrical Characteristics - TO-92/LPG Pulse Count to Temperature LUT | ||
| VP – VN = 2.15 V | ||
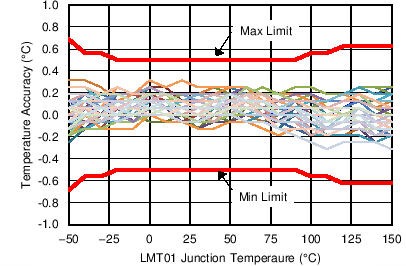
| Using Electrical Characteristics - TO-92/LPG Pulse Count to Temperature LUT | ||
| VP – VN = 2.7 V | ||
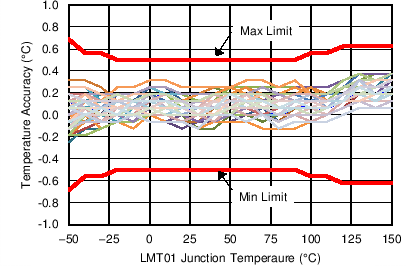
| Using Electrical Characteristics - TO-92/LPG Pulse Count to Temperature LUT | ||
| VP – VN = 4 V | ||
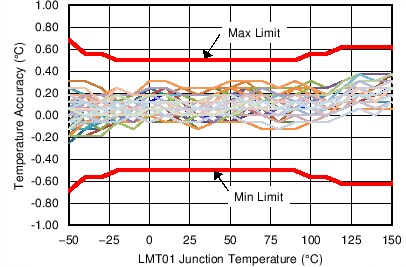
| Using Electrical Characteristics - TO-92/LPG Pulse Count to Temperature LUT | ||
| VP – VN = 5.5 V | ||
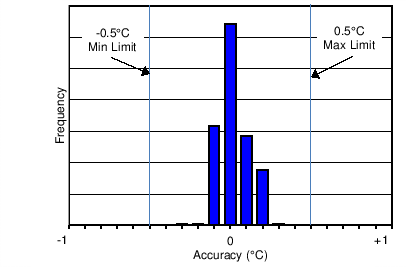
| Using Electrical Characteristics - TO-92/LPG Pulse Count to Temperature LUT | ||
| VP – VN = 2.15 V to 5.5 V | ||
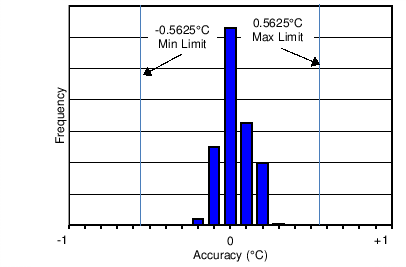
| Using LUT Electrical Characteristics - TO-92/LPG Pulse Count to Temperature LUT | ||
| VP – VN = 2.15 V to 5.5 V | ||
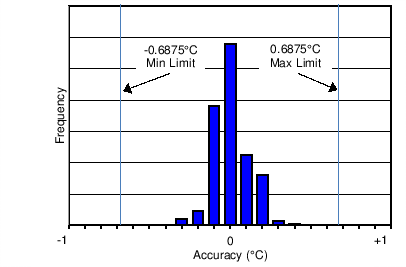
| Using LUT Electrical Characteristics - TO-92/LPG Pulse Count to Temperature LUT | ||
| VP – VN = 2.15 V to 5.5 V | ||
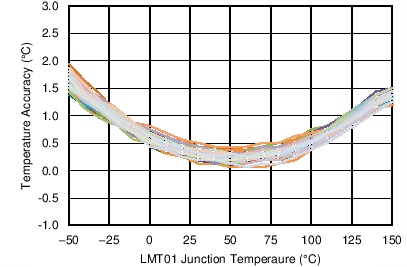
| Using Temp = (PC/4096 × 256°C ) – 50°C | |
| VP – VN = 5.5V |
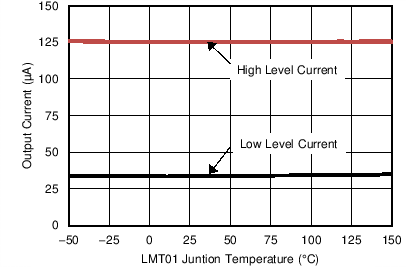
| VP – VN = 3.3 V |
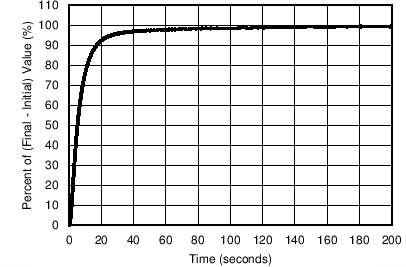
| VP – VN = 3.3 V | Air Flow = 2.34 meters/sec | |
| TINITIAL = 23°C, | TFINAL = 70°C | |
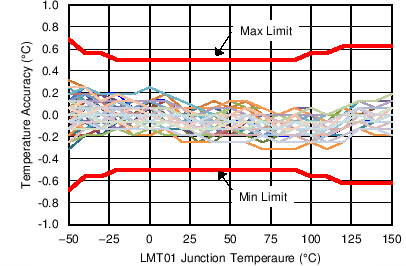
| Using Electrical Characteristics - TO-92/LPG Pulse Count to Temperature LUT | ||
| VP – VN = 2.4 V | ||
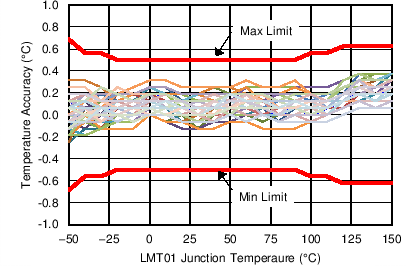
| Using Electrical Characteristics - TO-92/LPG Pulse Count to Temperature LUT | ||
| VP – VN = 3 V | ||
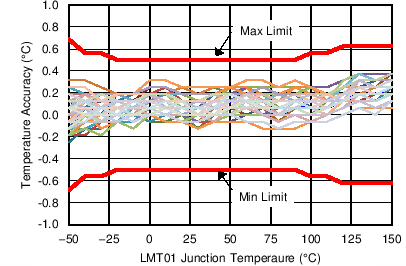
| Using Electrical Characteristics - TO-92/LPG Pulse Count to Temperature LUT | ||
| VP – VN = 5 V | ||
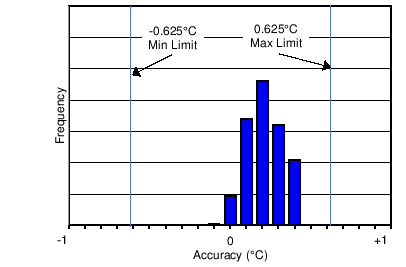
| Using Electrical Characteristics - TO-92/LPG Pulse Count to Temperature LUT | ||
| VP – VN = 2.15 V to 5.5 V | ||
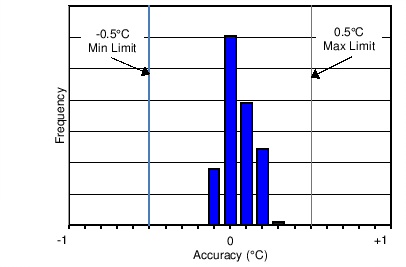
| Using Electrical Characteristics - TO-92/LPG Pulse Count to Temperature LUT | ||
| VP – VN = 2.15 V to 5.5 V | ||
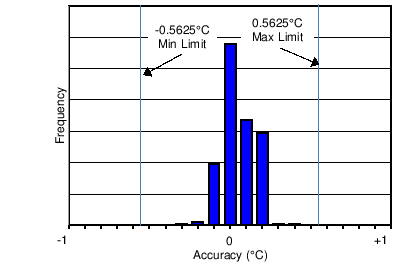
| Using Electrical Characteristics - TO-92/LPG Pulse Count to Temperature LUT | ||
| VP – VN = 2.15 V to 5.5 V | ||
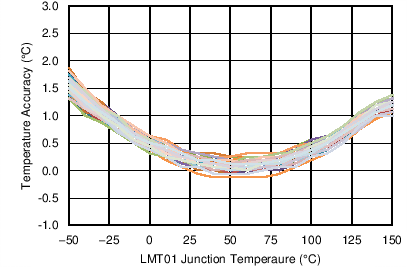
| Using Temp = (PC/4096 × 256°C ) – 50°C | |
| VP – VN = 2.15 V | |
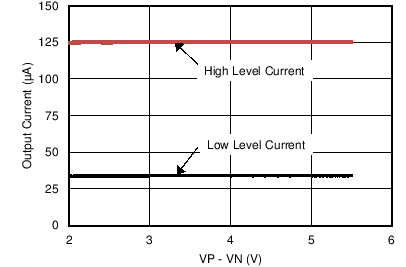
| TA = 30°C |
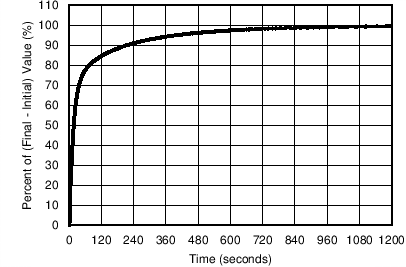
| VP – VN = 3.3 V | ||
| TINITIAL = 23°C, | TFINAL = 70°C |
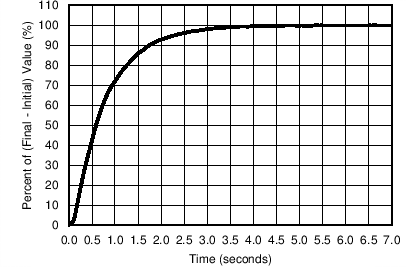
| VP – VN = 3.3 V | ||
| TINITIAL = 23°C, | TFINAL = 70°C |